5 STEPS TO SETTING UP THE MONITOR:
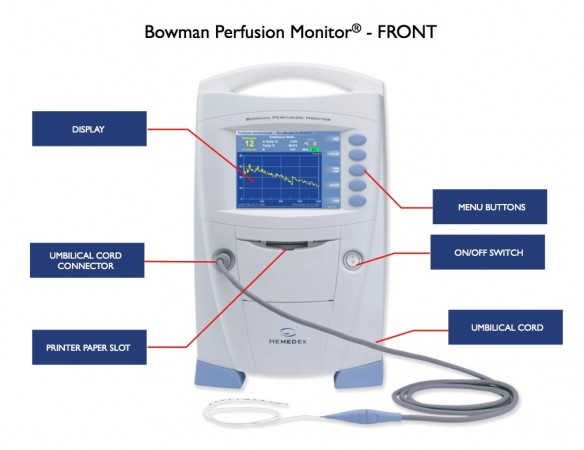
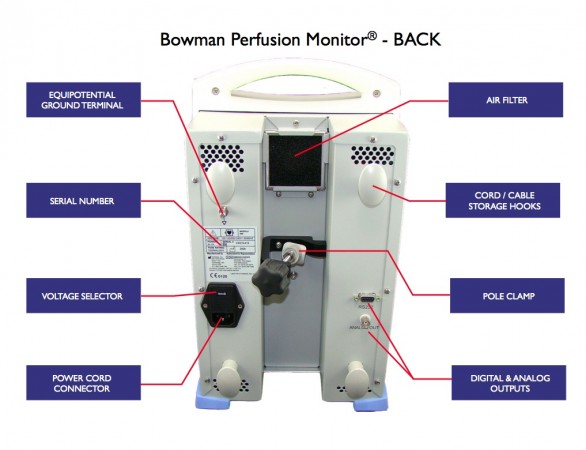
1. Mount monitor on pole or place on shelf
2. Connect the power chord
3. Connect the umbilical cord
4. Turn monitor on
5. Connect the Probe to the umbilical cord following placement
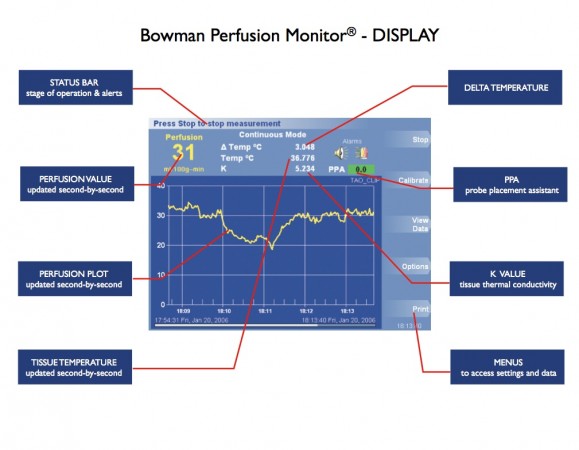
Status Bar: indicates the current operational phase of the monitor, time remaining until next phase, and status alerts.
Perfusion Value: large numerical display of perfusion in absolute units updated second-by-second
Perfusion Plot: patient perfusion plotted over time updated second-by-second in absolute units of ml/100g-min
Tissue Temperature: tissue temperature updated second-by-second
Delta Temperature:
-During Temperature Stabilization Phase ΔTemp indicates the temperature difference between the 2 sensors of the probe when the tip sensor is not being heated.
-During Perfusion Measurement Phase ΔTemp indicates probe temperature in degree °C above the tissue temperature (Temp) when the tip sensor is being heated.
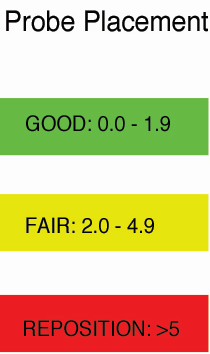
PPA: Probe Placement Assistant, a tool that informs the clinician of the quality of the signal measured by the probe that reflects the presence of cardiac induced pulsatility which may introduce artifact. The following are the ranges of the PPA value:
K Value: tissue thermal conductivity is a function of tissue water content and ranges between 4.8-5.9 in brain tissue.
Menus: these buttons provide access to the various features of the monitor.
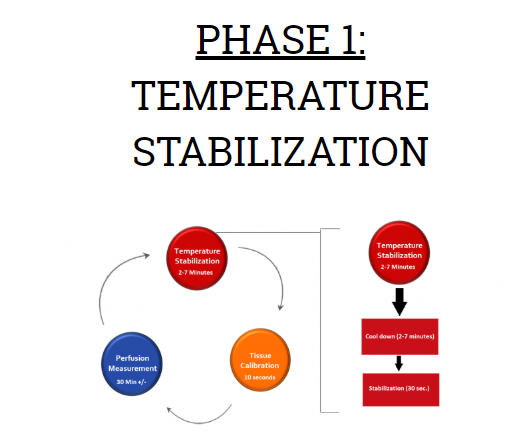
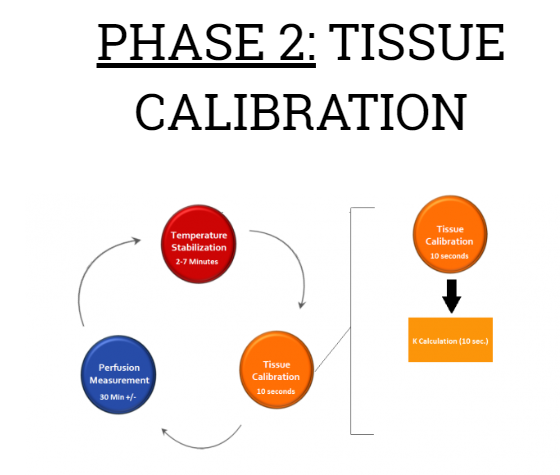
PHASES OF THE MEASUREMENT CYCLE:
The Bowman Perfusion Monitor automatically cycles through these phases of measurement.
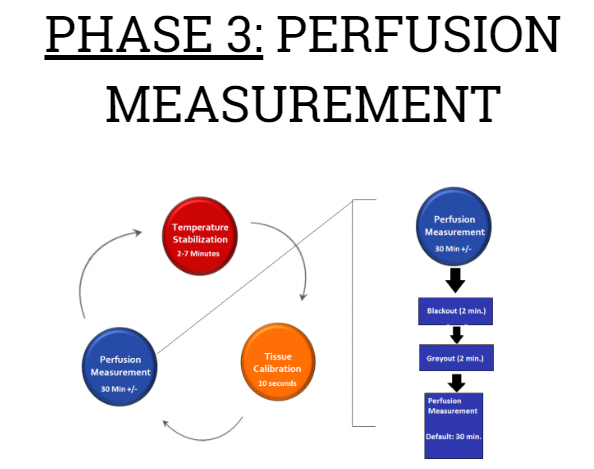
The first two minutes after calibration are referred to as Blackout.
During Blackout, the thermal field is at the early stages of development and therefore no data is presented.
The next two minutes are referred to as Grayout.
The thermal field is more developed and the BPM presents a blinking perfusion value.
When the perfusion value stops blinking, the thermal field is sufficiently developed and the data will start to plot on the screen.
The BPM will then monitor perfusion for the selected period of time (default 30 minutes).


